Easy website analytics reporting with Juuced

Effortlessly monitor and analyze your website traffic

Data Driven Marketing

All Google Analytics Metrics & Dimensions You Need.
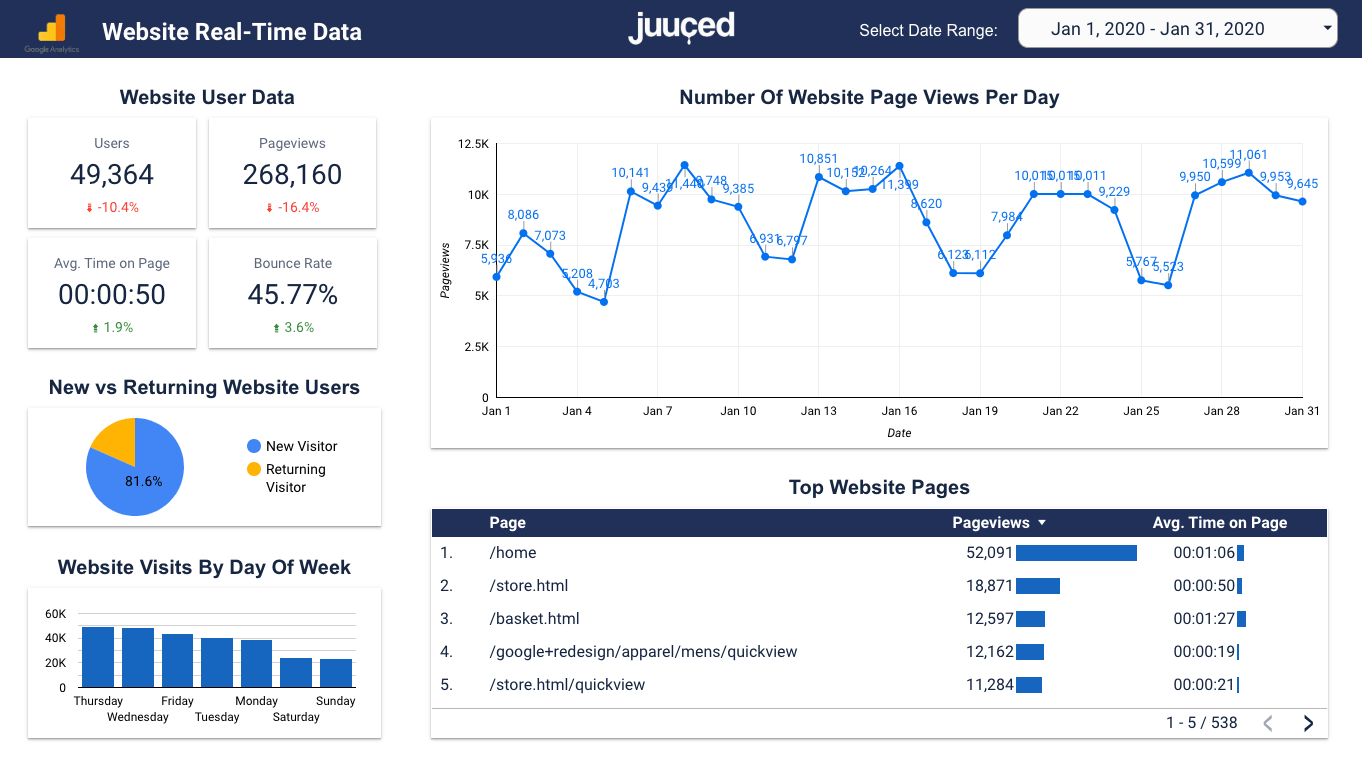
Juuced_Data_Report_Website_Analytics

  • Users
  • Pageviews
  • Avg. Time on Page
  • Bounce Rate
  • New vs. Returning Visitors
  • Visits by Day-of-Week
  • Page Views per Day
  • Top Website Pages

How It Works

Website reporting made easy

We connect your marketing data sources to our portal and you get a link to your real-time automated reports. Easy as that!

Understanding the Data

  • Users

    This is the total number of users visiting your website in the selected time frame.


    Users are defined by a unique ID – this ID is usually stored in a cookie. Whenever the tracking code is executed, it looks for cookies on the browser set by the current domain. If they can’t be found, new cookies with a new ID are set. 

  • Pageviews

    This is the total number of Pageviews of your website in the selected time frame.


    A pageview is recorded every time a page is viewed. Or, more technically, a pageview is recorded every time the Google Analytics pageview tracking method is executed. When a user hits the back button, a pageview is recorded. When a visitor hits refresh, a pageview is recorded. Every time a page is opened in the browser, regardless of whether it has been cached, a pageview is recorded. 

  • Avg. Time on Page

    This is the average time user spent on your website pages in the selected time frame.


    Time on Page is measured by subtracting the time a visitor hits a page from the time they hit the next page. (e.g. If they hit Page 1 at 12:00 and hit Page 2 at 12:03, time on Page 1 is three minutes.) 

  • Bounce Rate

    Bounce rate is the percentage of single page visits on your website during the selected time frame. It is the percentage of visits in which a person leaves your website from the landing page without browsing any further. 

  • Number of Website Pageviews Per Day

    A Pageview is recorded every time a page is opened in the browser. This chart shows the total number of website pageviews for each day in the selected time frame.

  • New vs. Returning Website Users

    This chart shows the percenatge of New vs Returning visitors to your website in the selected time frame.


    A New Visitor is a visitor who did not have a Google Analytics cookie when they landed on your website page.


    A Returning Visitor is a  visitor with existing Google Analytics cookies from a previous visit.

  • Website Visits By Day Of Week

    This chart is of the average number of website visits for each day of the week in the selected time frame.

  • Top Website Pages

    This is a chart of the pages from your website with the most visits in decending order in the selected time frame.

Companies Growing with Juuced Data Reporting

Get Your Custom Real-Time Data Report Today!

$49.99/Month

Juuced Data Report Form

Share by: